Multi-Timeframe Analysis
How to read a market top-down across three timeframes: the higher one for trend, the middle for setups and the lower for entries, with a worked example.
Open a 15-minute chart and you might see a clear downtrend. Switch to the daily chart and the same move may be nothing more than a small dip in a strong uptrend. Neither view is wrong; they answer different questions. Multi-timeframe analysis puts them together, so you trade in the direction of the bigger picture and use the smaller one only to time your entry.
This lesson sets out a simple three-timeframe framework, a step-by-step top-down routine, a worked Bitcoin example and the mistakes that trip people up, using the timeframes available on the Traders Portal chart.
Open a trade on Traders Portal
Why one timeframe is not enough
Every timeframe is a slice of the same price history. A daily candle contains 24 hourly candles; an hourly candle contains 60 one-minute candles. Trends, levels and patterns exist on all of them at once, often pointing in different directions.
A trader who only watches a 5-minute chart can be buying confidently right into a daily resistance level they never saw. A trader who only watches the daily chart may have the direction right but enter at a poor price with a very wide stop. Looking at both fixes both problems.
The three-timeframe framework
The usual approach uses three timeframes, each roughly four to six times the next:
- Higher timeframe: the context. Which way is the trend, and where are the major support and resistance levels?
- Middle timeframe: the setup. Is price pulling back to a level, forming a pattern or breaking out?
- Lower timeframe: the trigger. Is there a specific signal, such as a break of a small swing or a strong candle, to enter on?
| Style | Higher (context) | Middle (setup) | Lower (entry) |
|---|---|---|---|
| Scalping | 1h | 15m | 1m |
| Day trading | 4h | 1h | 15m |
| Swing trading | 1D | 4h | 1h |
| Longer-term swing | Weekly (separate tool) | 1D | 4h |
The exact set matters less than using the same one consistently. Scalping vs Day Trading vs Swing Trading explains how to choose a style in the first place.
A top-down routine
- Read the higher timeframe
Identify the trend from the sequence of swing highs and lows, as in Trendlines, Channels and Market Structure, and mark the major levels. Decide which direction you will look for.
- Wait for a setup on the middle timeframe
Look for price to reach a level that matters on the higher timeframe, such as a pullback to former resistance turned support in an uptrend.
- Find the trigger on the lower timeframe
Wait for the lower chart to show price turning in your direction, for example a break above the last small swing high or a strong engulfing candle.
- Set the stop from the setup
Place the stop where the middle-timeframe idea is proven wrong, usually beyond the pullback's swing low or high, then size the position from that distance.
- Take targets from the higher timeframe
The next major level on the higher timeframe is a natural target, because that is where the bigger picture may push back.
A worked example
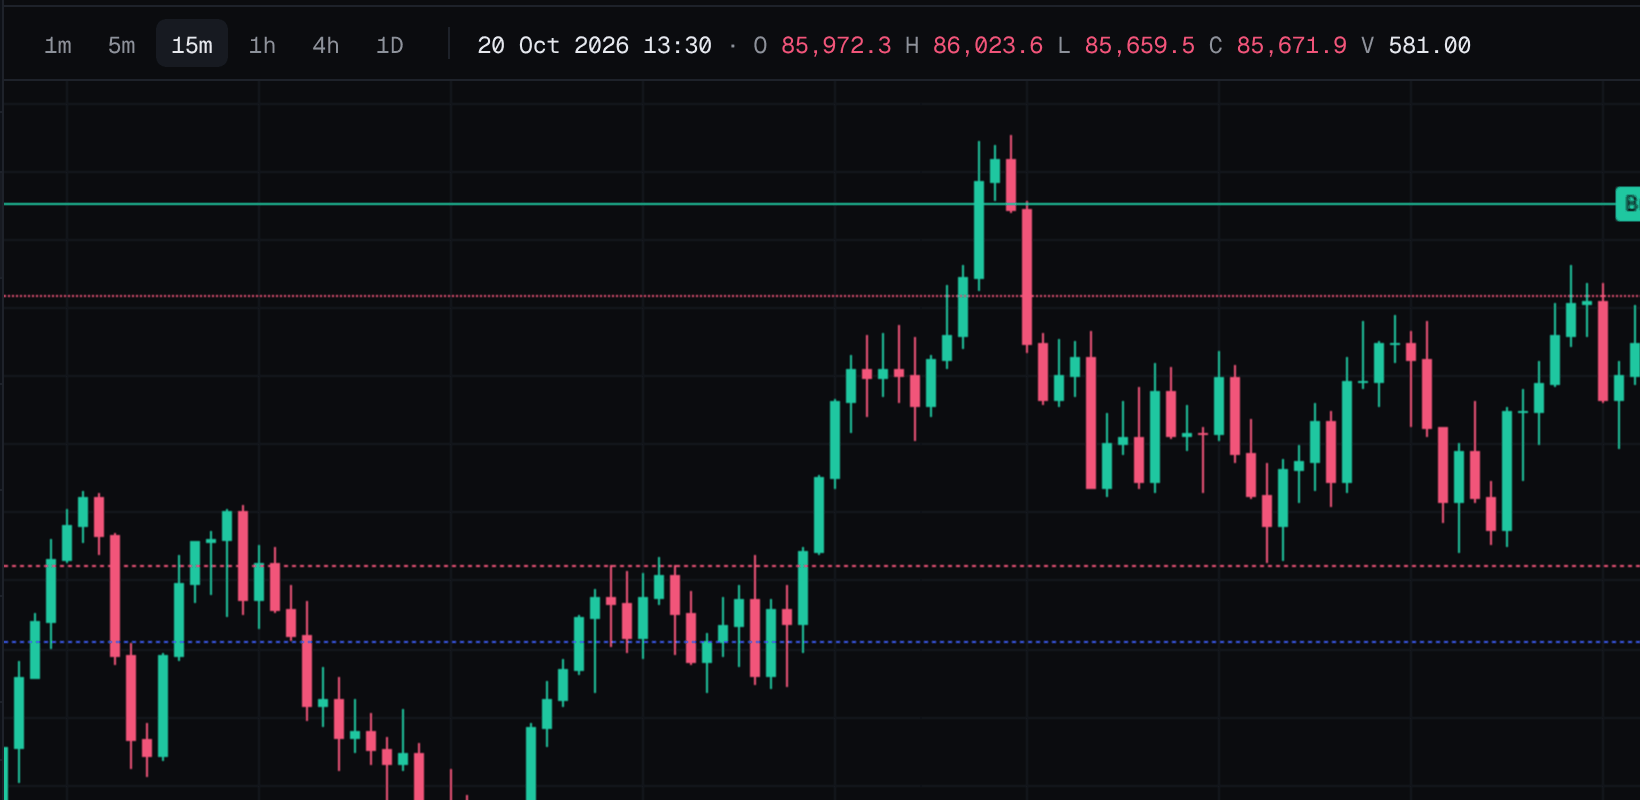
Notice what each timeframe did. The daily chart chose the direction and the target. The 4-hour chart chose the area and the stop. The hourly chart only chose the moment. That combination of a nearby stop and a distant target is why top-down trades can offer favorable reward-to-risk ratios, although a farther target is also reached less often. Risk/Reward Ratio and Win Rate explains that trade-off.
When timeframes disagree
Disagreement is normal. The daily chart may be rising while the 4-hour chart is in a clear decline. You have three reasonable options:
- Wait until the lower timeframes turn back in the direction of the higher one.
- Trade smaller, accepting that the odds are less clear.
- Treat it as a counter-trend trade, with a closer target and a quicker exit.
Decide which you will use before you open the chart. Choosing in the moment usually means choosing whatever fits the trade you already want.
Also watch for the point where a lower-timeframe move grows large enough to change the higher picture. If that 4-hour decline carried price to a close below the last daily swing low, the daily uptrend itself would be in question, and the right response would be to reassess the context rather than keep looking for buy setups.
Common mistakes
- Timeframe shopping. Flicking through charts until one agrees with what you want to do.
- Too many timeframes. Five or six views almost always contain a conflict, which leads to hesitation.
- Stops from the lowest timeframe. A 1-minute stop can be so tight that ordinary noise and the spread hit it.
- Forgetting the candle is still open. A higher-timeframe candle that is only halfway through can still change shape completely.
Multi-timeframe analysis on Traders Portal
The trade chart offers 1m, 5m, 15m, 1h, 4h and 1D, so you can switch between your three timeframes with one click. For a weekly view, use a separate charting tool. The Markets page quick view adds longer-range context, including its Daily trend section and 7-day, 30-day and 52-week highs and lows.
Conclusion
Multi-timeframe analysis is a way of asking three questions in order: which way is the market going, where is a sensible place to join it, and when exactly should you act? The higher timeframe answers the first, the middle the second, the lower the third. Keep the set consistent, take your stop from the timeframe that defines the idea, size from that distance, and when the timeframes disagree, remember that waiting is a valid decision.
Related reading
FAQs
- How many timeframes should I use?
- Three is the usual number: one for the trend, one for the setup and one for the entry. Two can work for simpler approaches. More than three tends to produce conflicting signals and slows decisions down.
- How far apart should the timeframes be?
- A common guideline is a factor of about four to six between them, for example 1D, 4h and 1h, or 1h, 15m and 5m. Timeframes too close together show nearly the same picture; too far apart and the lower one loses its connection to the higher one.
- What should I do when the timeframes disagree?
- Many traders simply wait for them to line up. Others trade smaller, or treat the trade as a short counter-trend move with a closer target. What matters is deciding your rule in advance rather than in the moment.
- Is there a weekly chart on the platform?
- The trade chart's timeframes run from 1 minute to 1 day. For a weekly view you can use a separate charting tool, and the Markets page quick view gives longer-term context such as the daily trend and 30-day and 52-week highs and lows.
- Which timeframe should my stop loss come from?
- Usually from the timeframe that defines your trade idea, often the middle one. A stop based only on a 1-minute chart is often so tight that normal noise reaches it.