Top Candlestick Patterns and Their Context
The candlestick patterns traders watch most, from doji and hammers to engulfing candles and morning stars, and the context that decides whether they matter.
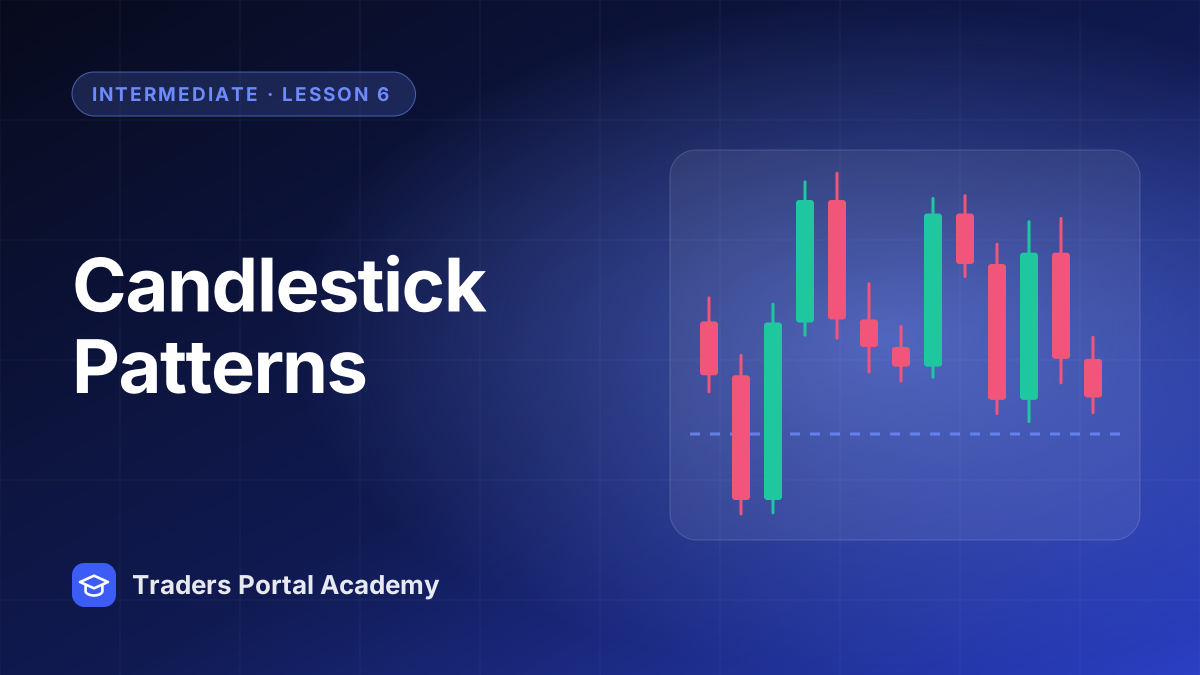
Candlestick patterns are short sequences of one to three candles that traders have named because they often appear around turning points or pauses. A long lower wick, a big candle swallowing the previous one, a tiny body between two large ones: each tells a small story about who controlled price during that period and whether that control is changing.
The shapes are easy to memorize. The harder skill, and the one this lesson focuses on, is context: where the pattern forms, what the trend is doing and whether the next candles confirm it. If you need a refresher on bodies, wicks and how a candle is built, start with Reading a Candlestick Chart for the First Time.
Open a trade on Traders Portal
Single-candle patterns
Doji. The open and close are almost equal, leaving a very thin body. It shows indecision: buyers and sellers ended the period roughly where they started. After a long trend, a doji can be an early sign that momentum is pausing.
Hammer and hanging man. A small body near the top of the range with a long lower wick, at least twice the body, and little or no upper wick. After a decline it is called a hammer: sellers pushed price down, then buyers drove it back up. The same shape after a rise is a hanging man, a warning that selling pressure appeared during the period.
Shooting star and inverted hammer. The mirror image: a small body near the bottom with a long upper wick. After a rise it is a shooting star, showing buyers were rejected at higher prices. After a fall it is an inverted hammer.
Marubozu. A large body with little or no wick. One side controlled the whole period, which often signals strength in the direction of the candle rather than a reversal.
Two-candle patterns
Engulfing. A bullish engulfing pattern is a down candle followed by an up candle whose body completely covers the first body. A bearish engulfing pattern is the reverse. It shows one side overwhelming the other within a single period.
Harami (inside bar). A large candle followed by a small one whose body sits inside the first body. It signals a pause or loss of momentum after a strong move, and traders often watch for a break of the larger candle's high or low.
Tweezer tops and bottoms. Two candles with matching highs (top) or matching lows (bottom), showing a price that was rejected twice in a row.
Three-candle patterns
Morning star and evening star. A morning star starts with a strong down candle, then a small-bodied candle (often a doji), then a strong up candle closing well into the first candle's body. It describes selling fading and buying taking over. The evening star is the bearish mirror image at the top of a rise.
Three white soldiers and three black crows. Three consecutive strong candles in the same direction, each closing near its extreme. They show sustained pressure, and often appear at the start of a move away from a base.
| Pattern | Candles | What it shows | Most meaningful when |
|---|---|---|---|
| Doji | 1 | Indecision | After an extended move, at a level |
| Hammer / shooting star | 1 | Rejection of lower / higher prices | At support / at resistance |
| Engulfing | 2 | One side overwhelming the other | At a level, against a stretched move |
| Harami (inside bar) | 2 | Pause after a strong candle | Before a break of the large candle |
| Morning / evening star | 3 | Gradual change of control | After a clear trend, at a level |
| Three soldiers / crows | 3 | Sustained pressure | Breaking away from a base or range |
Context decides whether a pattern matters
The same shape can mean very different things depending on its surroundings. Before you act, run through these questions:
- Where is it? Patterns at well-tested support or resistance, covered in Support and Resistance, are worth far more than those in the middle of a range.
- What is the trend? A bullish pattern on a pullback within an uptrend lines up with the bigger picture. The same pattern against a strong downtrend is fighting it.
- What timeframe? A daily hammer summarizes a full day of trading. A 1-minute hammer summarizes sixty seconds and is mostly noise.
- Is there volume behind it? An engulfing candle on unusually high volume shows more participation than one on a quiet session.
- Did the next candle confirm it? Many traders wait for the following candle to trade beyond the pattern's high (for a bullish pattern) or low (for a bearish one).
Turning a pattern into a trade plan
On Traders Portal, you would place this on the Limit / Stop tab: a buy price above the Ask becomes a Buy Stop. Switch the size to Lots and check the Contract size row to convert 0.5 ETH into lots. Position Sizing walks through that conversion step by step.
Reading candles on Traders Portal
The trade chart offers the timeframes 1m, 5m, 15m, 1h, 4h and 1D, and several chart types. For pattern work, use candles or hollow candles. Heikin-Ashi candles are built from averaged prices, so they smooth trends nicely but change the opens, closes and wicks that classic patterns depend on. The platform does not detect patterns for you; you read them yourself.
Conclusion
Candlestick patterns are short stories about control: rejection wicks, engulfing bodies and star formations show one side gaining ground on the other. Learn the shapes, but judge them by their context: the level they form at, the trend around them, the timeframe and whether the next candle confirms them. Wait for the candle to close, put your stop beyond the pattern, size the trade from that distance, and accept that many patterns will fail. Used that way, they become a useful timing tool rather than a guess. Chart Patterns takes the same ideas to larger formations.
Related reading
FAQs
- Which candlestick pattern is the most reliable?
- No single pattern is reliable on its own. Engulfing candles, hammers and shooting stars are widely watched, but their usefulness depends far more on where they form, the trend and the timeframe than on the shape itself.
- Should I trade a pattern before the candle closes?
- Most traders wait. Until the candle closes, its body and wicks can still change completely, so a hammer halfway through the hour may end as an ordinary down candle. The candle-close countdown in the chart settings shows how long is left.
- Do candlestick patterns work on Heikin-Ashi charts?
- Not in the usual way. Heikin-Ashi candles are built from averaged prices, so their opens, closes and wicks differ from the real ones. Switch to regular or hollow candles when you look for classic patterns.
- What timeframe is best for candlestick patterns?
- Patterns on higher timeframes, such as 4-hour and daily candles, summarize more trading and tend to carry more weight than patterns on 1-minute or 5-minute charts, which are full of noise. Whatever the timeframe, the pattern still needs a sensible location.
- Does the platform detect candlestick patterns for me?
- No. The chart shows the candles and their open, high, low and close, and you judge the patterns yourself. That is no bad thing, because the context that decides whether a pattern matters has to be judged by you anyway.