Reading a Candlestick Chart for the First Time
What each part of a candle tells you, how open, high, low and close fit together, how timeframes change the picture, and how to set up the trade chart to read them.
A price chart is the market's diary. Every trade that happened is in there, but a raw list of prices would be impossible to read. A candlestick chart solves that by squeezing each slice of time, such as one hour or one day, into a single shape that shows where the price started, where it finished and how far it travelled in between.
Once you can read one candle, you can read a chart. This lesson takes you from a single candle to a run of them, explains how timeframes change what you see, and shows you how to set up the chart on Traders Portal so the details you need are always visible.
The four prices inside one candle
Each candle records four prices for its period, often shortened to OHLC:
- Open: the first price of the period.
- High: the highest price reached.
- Low: the lowest price reached.
- Close: the last price of the period.
The thick part of the candle is the body. It runs from the open to the close. The thin lines above and below are the wicks (also called shadows). They reach up to the high and down to the low.
If the close is above the open, the candle is a rising candle, usually shown in green. If the close is below the open, it is a falling candle, usually red.
That last point is why wicks matter. The close is the headline, but the wicks show what your position actually lived through.
Reading the body and the wicks
The shape of a candle summarizes the fight between buyers and sellers in that period. A few shapes come up again and again.
| Shape | What happened in the period | A cautious reading |
|---|---|---|
| Long rising body, small wicks | Price climbed most of the period and closed near the high | Buyers were in control for that period |
| Long falling body, small wicks | Price fell most of the period and closed near the low | Sellers were in control for that period |
| Long upper wick | Price traded much higher, then was pushed back down | Selling showed up at higher prices |
| Long lower wick | Price traded much lower, then recovered | Buying showed up at lower prices |
| Tiny body, wicks on both sides | Open and close almost equal | Balance or indecision |
The tiny-body candle has a name, the doji. Named shapes and multi-candle patterns are covered in Top Candlestick Patterns and Their Context. For now, the key habit is to ask two questions of every candle: where did it close within its range, and how far did the price travel before it got there?
Timeframes: the same market at different zoom levels
The timeframe is how much time each candle covers. The Traders Portal chart offers 1m, 5m, 15m, 1h, 4h and 1D. A 4h candle is simply four 1h candles merged: the open of the first, the close of the last, the highest high and the lowest low.
On the 4h chart this looks like a quiet, slightly rising candle with long wicks. The hourly chart shows the climb to 60,700 and the slide back. Neither view is wrong; they answer different questions. Higher timeframes show the bigger picture with less noise; lower timeframes show detail and timing. Multi-Timeframe Analysis shows how traders combine them.
Remember that crypto trades around the clock, while forex, stocks, indices and commodities have trading sessions. On those markets a 1D candle can cover fewer hours, and a gap can appear when a market reopens at a different price from where it closed.
Reading a run of candles
Single candles are noisy. The story comes from the sequence. When each swing up reaches a higher high and each pullback stops at a higher low, the market is in an uptrend. Lower highs and lower lows describe a downtrend. Candles overlapping sideways describe a range.
Areas where several candles turned around are worth noting, because traders often watch them again. Those are the starting points for Support and Resistance and for Trendlines, Channels and Market Structure.
Setting up the Traders Portal chart
The chart on the trade screen has everything you need to read candles. Open the settings with the gear icon:
- Chart type: Candles, Hollow, Heikin-Ashi, Bars, Line or Area. On a phone, a toggle switches between line and candles.
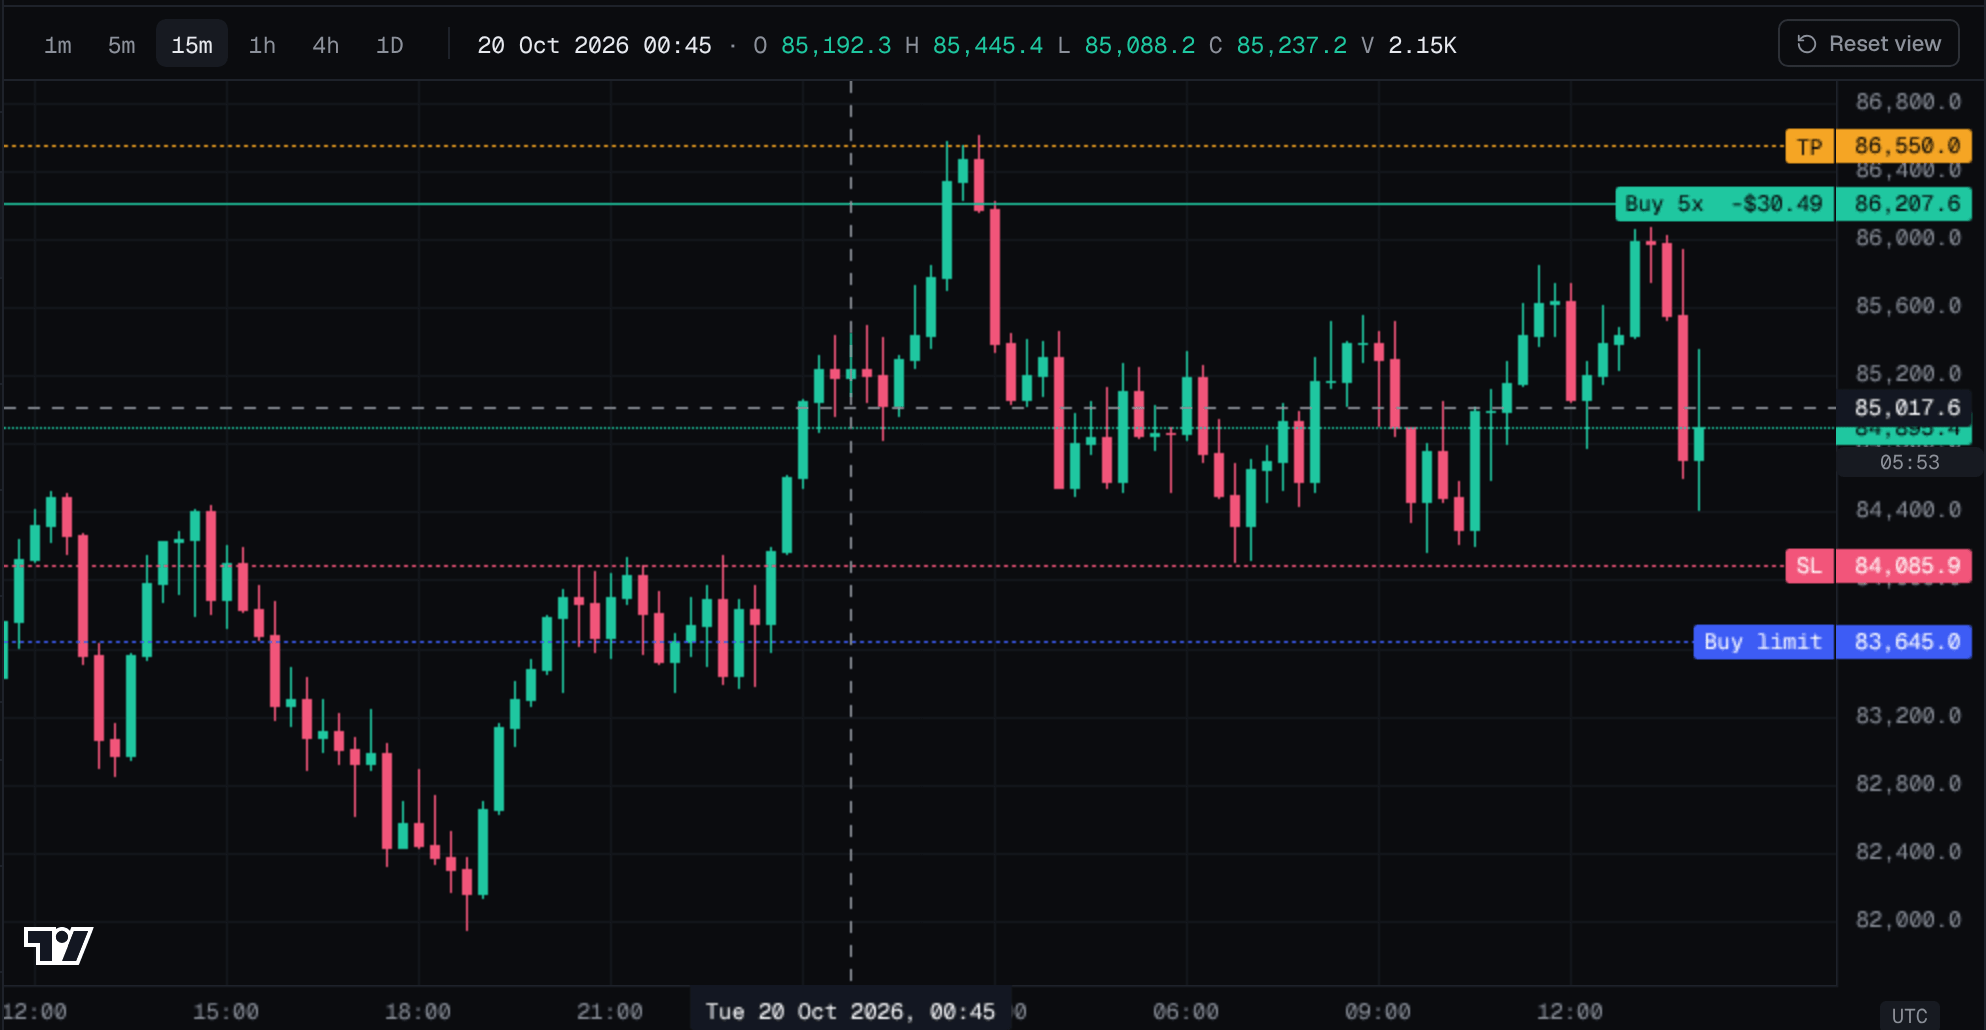
- OHLC legend: shows the open, high, low and close of the candle under your cursor, so you can read exact values.
- Volume bars: a pane under the price showing how much traded in each period.
- Rising and falling candle colors, grid lines and the price scale (Normal, Log or %).
- Time zone: UTC or your own, which matters when you compare daily candles.
You can save up to three setups as templates. The chart can also show Bid and Ask lines. The candles show the market's reference price, while your orders fill at the Ask when you buy and the Bid when you sell.
Conclusion
A candlestick is four prices in one shape: open, high, low and close. The body tells you who won the period; the wicks tell you how far the price roamed. Change the timeframe and you change the zoom, not the market. Read candles in sequence and in context rather than one at a time, judge them by their close, and treat them as a record of what happened, not a forecast. With the OHLC legend and countdown switched on, the Traders Portal chart gives you exact numbers to work with.
Related reading
FAQs
- What do the green and red candles mean?
- A rising candle closed higher than it opened and is usually shown in green. A falling candle closed lower than it opened and is usually shown in red. You can change both colors in the chart settings.
- What is a wick on a candle?
- A wick, also called a shadow, is the thin line above or below the body. It shows the highest and lowest prices traded during the period, beyond where the candle opened and closed.
- Why does the last candle keep changing?
- The most recent candle is still forming. Its high, low and close can change until its time period ends, which is why the candle-close countdown in the chart settings can be useful.
- Which timeframe should a beginner use?
- There is no single right answer. Higher timeframes such as 4h or 1D move more slowly and show less noise, so many beginners find it easier to read those first and then look at shorter timeframes for detail.
- Are Heikin-Ashi candles real prices?
- No. Heikin-Ashi candles are calculated from averages of recent prices to smooth the chart. They can make trends easier to see, but their open and close are not prices that actually traded, so use regular candles when you need exact levels.
- Can a candlestick tell me where the price will go next?
- No. A candle is a record of what already happened in one period. Traders use candles as clues, read together with trend, key levels and the bigger picture, but no single candle predicts the next move.