Support and Resistance: Drawing Levels That Matter
How to find the support and resistance zones traders actually watch, judge how strong they are, handle breaks and retests, and turn a level into a plan with a defined risk.
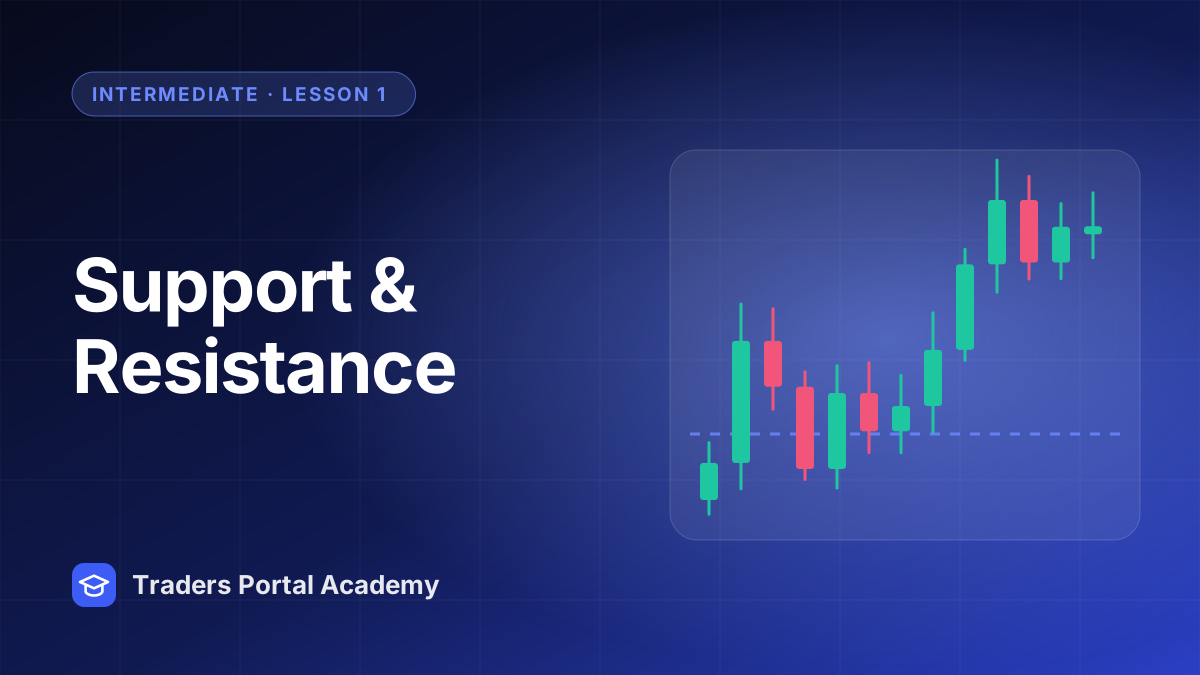
Look at almost any chart and you will see prices that keep turning at roughly the same places. A falling market stops and bounces near a certain price, again and again. A rising market stalls under another. Those areas are support (a floor where buying has tended to appear) and resistance (a ceiling where selling has tended to appear).
They are probably the most widely used idea in technical analysis, and also among the easiest to overdo. This lesson shows you how to find the levels that matter, judge their strength, handle breaks and false breaks, and turn a level into a trade plan with a risk you set in USDT.
Why support and resistance form
Levels are not magic. They form because markets have memory and orders cluster:
- Memory. Traders who missed a bounce at a price want another chance there. Traders who bought at a peak and are losing may sell when the price returns to their entry.
- Clustered orders. Limit orders, stop losses and take profits tend to gather around the same visible prices.
- Round numbers. Prices such as 60,000 for Bitcoin or 2,400 for gold attract attention and orders.
Because so many people watch the same areas, reactions there become partly self-fulfilling. But a level is an area of interest, not a wall. Every level eventually breaks.
How to find levels that matter
- Start on a higher timeframe
Open the 1D chart, then the 4h. Levels visible there are watched by more traders than those on a 5-minute chart. See Reading a Candlestick Chart if timeframes are new.
- Find the obvious turning points
Look for swing highs and swing lows where the price reversed sharply. If you have to squint to see a level, it probably is not one.
- Look for repeat reactions
A price area that turned the market two, three or more times is more meaningful than a single touch.
- Mark a zone, not a line
Cover the cluster of wicks and candle bodies around the turns. The OHLC legend gives you the exact highs and lows.
- Keep only the nearest few
Two or three levels above the price and two or three below are plenty. Delete the rest.
How strong is a level?
| Factor | Stronger | Weaker |
|---|---|---|
| Reactions | Several clear turns | A single touch |
| Timeframe | 4h or 1D | 1m or 5m |
| Move away | Sharp and large | A small drift |
| Age | Recent and still respected | Old and ignored since |
| Volume | Heavy volume at the turn | Thin volume |
One nuance: a level tested many times in quick succession can weaken, because the orders sitting there get used up with each visit. Repeated hits in a short time can be a sign that a break is building rather than that the level is unbreakable.
Breaks, retests and false breaks
When the price moves decisively through a level, the level often swaps roles. Broken resistance becomes support; broken support becomes resistance. This is called role reversal, and the return to the old level is called a retest.
Not every break holds. In a false break, the price pokes through a level, triggers orders beyond it, then closes back inside the range. Many traders wait for a candle to close beyond the zone on their chosen timeframe before treating a break as real. That reduces false signals, but it does not remove them.
Turning a level into a trade plan
A level gives you three useful prices: where to enter, where you are wrong, and where the next obstacle sits. Here is how the numbers fit together.
On Traders Portal, open the Limit / Stop tab, choose Buy and enter 2,392. Because it is below the Ask, the panel labels it a Buy Limit. Switch on TP / SL and enter your prices, or type 30 into Loss (USDT). Check Value of $1 move reads about 1.5, and in Lots mode check the Min / step line, since lot sizes are rounded to each market's step. Remember that a pending order reserves margin as soon as you place it. For the math behind the 2.2 figure, see Risk/Reward Ratio and Win Rate.
Marking levels on Traders Portal
The trade chart on Traders Portal does not currently include drawing tools, so you need another way to keep track of your levels:
- Price alerts. Use the bell on a market row, or Account → Alerts, to be told when the price rises to or falls to a level. A range-break alert can tell you when a market trades above its previous 24-hour or 7-day high, or below its low.
- Orders as markers. Pending orders, take profits and stop losses appear as lines on the chart, and on desktop you can drag them to a new price.
- A separate charting tool. Many traders draw zones in a dedicated charting tool and place their orders on Traders Portal.
Levels are even more useful when combined with trend direction, covered next in Trendlines, Channels and Market Structure, and with Multi-Timeframe Analysis.
Conclusion
Support and resistance are areas where buyers or sellers have shown up before and may show up again. Find them on higher timeframes, mark them as zones, keep only the strongest few, and expect broken levels to switch roles, sometimes. Most of all, use a level to plan rather than to predict: it tells you where to enter, where your idea is wrong and where the next obstacle sits, so you can size the trade to a loss you have chosen in advance.
Related reading
FAQs
- Is support a single price or a zone?
- Treat it as a zone. Prices rarely turn at exactly the same number twice, so mark a band that covers the wicks and bodies where the market reacted rather than one perfect line.
- What makes a support or resistance level stronger?
- Several clear reactions, a higher timeframe such as 4h or 1D, sharp moves away from the level, recent relevance and heavy volume at the turn all add weight. A level touched once on a 1-minute chart carries little.
- What happens when support breaks?
- Broken support often acts as resistance when the price comes back to it, which is called role reversal. It does not always happen, and false breaks, where the price pokes through and then returns, are common.
- Where should a stop loss go when trading from a level?
- Usually beyond the zone with some extra room, not exactly at its edge, because obvious levels attract brief spikes. Then size the position so that the distance to the stop equals the amount you are willing to lose.
- Can I draw levels on the trade chart?
- The trade chart does not include drawing tools. You can note your levels, set price alerts at them, place pending orders there, or draw them in a separate charting tool and place your orders on the platform.