Moving Averages (SMA/EMA) and How Traders Use Them
How simple and exponential moving averages are calculated, how traders use them for trend, pullbacks and crossovers, and where they mislead.
Prices rarely move in a straight line. Even in a strong trend, a chart is full of spikes, dips and pauses that make the bigger picture hard to see. A moving average smooths that noise into a single line by averaging recent closing prices, then sliding forward one candle at a time. It is one of the oldest tools in technical analysis, and it sits behind many of the trend readings you will see on the Markets page.
This lesson shows how the two main types, the simple and the exponential moving average, are calculated, the four ways traders commonly use them, and where they mislead. As with every indicator, a moving average describes what price has done. It does not tell you what price will do next.
What a moving average is
A moving average takes the closing prices of the last n candles, averages them and plots the result. When a new candle closes, the oldest close drops out and the newest comes in, so the average "moves" along the chart.
The number n is the length, or period. A 20-period average on a daily chart averages the last 20 daily closes; on a 1-hour chart it averages the last 20 hourly closes. Short lengths hug the price and react quickly. Long lengths are smoother and slower, and show the broader trend.
The simple moving average (SMA)
The simple moving average adds up the closes and divides by the number of periods. Every close counts the same.
The SMA rose partly because a low, old price left the window, not only because a high new price arrived. This drop-off effect can make an SMA jump or stall for reasons that have little to do with today's market.
The exponential moving average (EMA)
The exponential moving average gives the newest close the most weight and lets older closes fade gradually instead of falling out all at once. It uses a smoothing factor, k = 2 ÷ (n + 1). For a 5-period EMA, k = 2 ÷ 6, about 0.33.
Each new value is: EMA = previous EMA + k × (close − previous EMA).
The EMA moved 40 points against the SMA's 36 from the same close. Over a run of strong closes that gap grows, which is why an EMA turns earlier at the start of a move, and also why one wild candle shakes it more.
| SMA | EMA | |
|---|---|---|
| Weighting | Every close counts equally | Recent closes count more |
| Speed | Slower to turn | Faster to turn |
| Noise | Smoother, fewer false turns | More sensitive, more false turns |
| Typical use | Longer-term trend (50, 200) | Shorter-term trend and pullbacks (9, 20) |
Four ways traders use moving averages
1. As a trend filter
The simplest use is to check which side of an average the price is on, and which way the average slopes. Price above a rising 50-period average suggests an uptrend; price below a falling one suggests a downtrend. Many traders only look for buy setups in the first case and sell setups in the second. A flat average with price weaving through it says there is no clear trend at all.
2. As moving support and resistance
In a steady trend, price often pulls back towards a shorter average, such as the 20-period, before continuing. Some traders treat that area as a zone to look for an entry, with a stop loss beyond the most recent swing. It is the same logic as the horizontal levels in Support and Resistance: a zone, not an exact line.
3. Crossovers
A crossover happens when a faster average crosses a slower one. Fast crossing above slow shows that recent prices have risen above the longer-run average; crossing below shows the opposite. On daily charts, the 50-day crossing above the 200-day is often called a golden cross, and crossing below a death cross. Because both averages lag, a cross usually confirms a move that is already well underway.
4. Measuring stretch
When price runs far from its average, some traders see the market as stretched. You can measure the distance in percent: a close of 3,300 against a 20-day average of 3,000 is (3,300 − 3,000) ÷ 3,000 = 10% above it. Mean-reversion traders look for a move back towards the average; trend traders wait for a pullback rather than buying the extreme. Breakout vs Mean Reversion Strategies covers both mindsets.
Where moving averages mislead
Every moving average is built from past prices, so it always lags, and the longer the average, the bigger the lag. That is tolerable in a trending market, where being late but on the right side can still work. It is costly in a ranging market, where price swings back and forth across a flat average and crossovers fire in both directions.
Averages are also blind to news. A surprise data release or a crypto event can carry price far beyond any average in seconds. Combine them with price structure, as described in Trendlines, Channels and Market Structure, rather than using them alone.
Moving averages on Traders Portal
The chart on the trade screen focuses on price and your orders; it does not currently plot indicators or drawing tools. Moving-average readings appear on the Markets page instead:
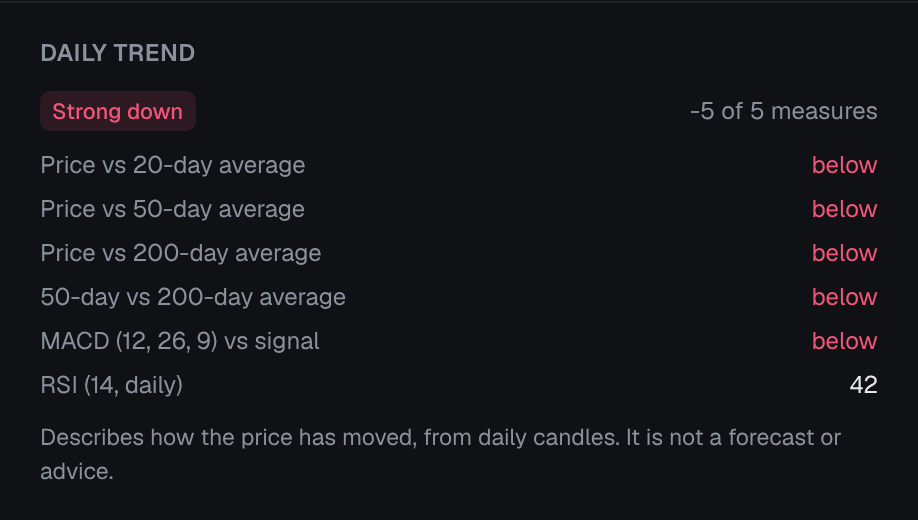
- The quick view for a market has a Daily trend section showing whether price is above or below its 20-, 50- and 200-day averages, and whether the 50-day is above the 200-day.
- The Opportunity scanner has screens such as MA cross up (a shorter hourly average crossing above a longer one) and 50/200 cross up or 50/200 cross down on daily candles. They are screens, not advice.
- The Signal column on the market list shows the latest screen that fired or, when none has, a simple trend reading.
To see the lines themselves, or to try your own lengths, you can plot averages in a separate charting tool and place and manage your orders on Traders Portal. Just make sure both show the same market and timeframe.
- Check the trend context
On the Markets page, open the quick view for the market and note where price sits against its main averages.
- Decide which side you will look at
A common approach is to look only for buy setups when the averages point up, only for sell setups when they point down, and to wait when they are mixed.
- Plan the trade on the trade screen
Pick your entry, place a stop loss beyond a recent swing, and enter it with the TP / SL switch before you confirm.
Conclusion
A moving average is an average of recent closes that slides forward with each candle. The SMA weights every close equally and moves steadily; the EMA leans on recent prices and turns sooner. Traders use them to filter trend direction, find pullback zones, read crossovers and judge when price is stretched. Their weakness is lag, which hurts most in sideways markets. Use them as context alongside price structure, keep your settings consistent, and protect every trade with a stop loss sized to what you can afford to lose.
Related reading
FAQs
- Which is better, the SMA or the EMA?
- Neither is better in general. The EMA reacts faster to new prices, so it turns sooner but also gives more false turns, while the SMA is smoother and slower. Pick one, learn how it behaves on the markets you trade, and stay consistent.
- Which moving average lengths do traders watch most?
- The 20, 50 and 200 periods are the most widely watched, with 9 or 10 sometimes used for very short-term momentum. The timeframe matters as much as the length: a 50-period average on a 1-hour chart covers about two days, while on a daily chart it covers about ten weeks.
- Is a golden cross a buy signal?
- It describes what has already happened: the 50-day average has risen above the 200-day average. Because both averages lag, the cross often arrives well after the move began, and in sideways markets crosses can flip back and forth. Treat it as context, not as an instruction to trade.
- Can I add moving averages to the chart on the trade screen?
- The trade chart does not currently plot indicators. The Markets page shows moving-average readings in the quick view and the opportunity scanner, and you can plot averages in a separate charting tool while placing your orders on the platform.
- Do moving averages work on crypto as well as on gold or indices?
- The calculation is the same on any market with a price history. How useful it is depends on how that market behaves: averages help most when a market trends and least when it chops sideways, whatever the asset.