Volume and Volatility: ATR, Bollinger Bands
How to read volume, measure volatility with ATR and Bollinger Bands, and use both to set stop distances and position sizes that fit the market.
Two markets can trend in the same direction and still need completely different handling. One drifts calmly 0.5% a day; the other swings 4% before lunch. Volatility is the size of those swings, and it decides how wide your stop must be and how large your position can be. Volume is the amount of trading behind a move, and it helps you judge how much conviction a move carries.
This lesson covers what volume can and cannot tell you, two of the most widely used volatility tools, the Average True Range (ATR) and Bollinger Bands, and how to turn them into practical stop and sizing decisions.
What volume tells you
Volume is how much of a market changed hands during a candle. On a chart it appears as bars under the price, one per candle. Traders use it in three main ways:
- Confirming breakouts. Price clearing a level on clearly above-average volume suggests broad participation. A breakout on thin volume is more likely to fail.
- Spotting climaxes. A huge volume spike after a long run can mark exhaustion, with late buyers or sellers piling in as the move ends.
- Reading quiet drift. Slow, low-volume moves often lack follow-through and reverse easily.
On CFDs, treat volume as relative. A CFD is priced from a reference feed, and the volume you see depends on that feed, so compare a market with its own recent average rather than with another market.
Volatility: how far price typically moves
Volatility is not good or bad; it is a measurement. It also changes. Markets go through quiet stretches and active ones, and volatility tends to cluster: busy days often follow busy days, especially around news such as inflation data, central bank decisions or company earnings. A stop that is comfortable in a quiet week can be hit by ordinary noise in a busy one.
ATR: the Average True Range
The true range of a candle is the largest of three distances:
- High − low
- The gap between the high and the previous close
- The gap between the low and the previous close
Including the previous close means overnight gaps count. The ATR is the average true range over a period, usually 14 candles.
Standard ATR uses a smoothed 14-period average rather than a plain one, but the idea is the same: it tells you how much ground the market usually covers per candle.
Using ATR for stops and size
Many traders place stops a multiple of ATR away from entry, such as 1.5 or 2 ATR, so ordinary noise is less likely to reach them. Then they size the position from that distance, as covered in Position Sizing.
Bollinger Bands
Bollinger Bands place a line above and below a moving average:
- Middle band: a 20-period simple moving average
- Upper band: middle + 2 standard deviations
- Lower band: middle − 2 standard deviations
A standard deviation measures how spread out recent closes are around their average. When prices swing widely, it grows and the bands widen; when prices are calm, the bands contract.
Traders read the bands in a few ways. In a range, touches of the outer bands can mark stretched prices, and some traders look for a drift back towards the middle. In a strong trend, price can "walk the band", closing near the upper or lower band candle after candle, so a touch alone is not a reversal signal. A squeeze shows quiet conditions that often precede a bigger move, but not its direction. Moving Averages explains the middle band in more detail.
| Volume | ATR | Bollinger Bands | |
|---|---|---|---|
| Measures | Trading activity per candle | Typical candle range, including gaps | Spread of closes around an average |
| Shows direction? | No | No | No |
| Common use | Confirming breakouts and climaxes | Stop distance and size | Relative extremes and squeezes |
| Main limit | Depends on the data feed | Lags sudden changes | Bands do not cap price |
Volume and volatility on Traders Portal
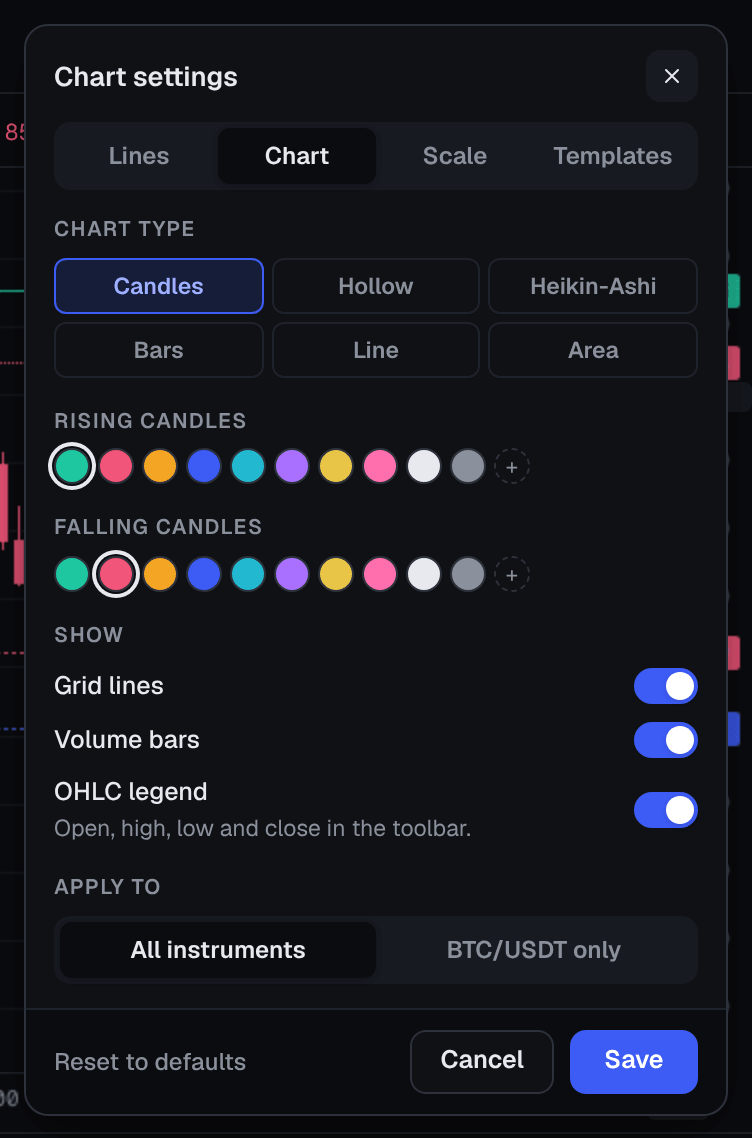
The trade chart does not currently plot indicators, but it helps in other ways. In the chart settings (the gear icon) on desktop, Volume bars adds a volume pane under the price, and OHLC legend shows each candle's open, high, low and close, which is all you need to work out true range yourself.
On the Markets page, the quick view stats include figures such as 24h range, Volume 24h and volume compared with its usual level, and the Opportunity scanner has a Volatility screen for markets whose latest hourly range is far above their recent average. A market's own page also shows Volatility (30 days).
For ATR and Bollinger Bands, you can use a separate charting tool and place your orders on Traders Portal, or estimate ATR by hand:
- Set the timeframe
Choose the timeframe you trade on, for example 1D, and turn on the OHLC legend in the chart settings.
- Read the recent candles
Hover over each of the last 10 to 14 candles and note the high, the low and the previous candle's close.
- Work out each true range
For each candle, take the largest of high − low, high − previous close and low − previous close.
- Average them
Add the true ranges and divide by the number of candles. That is your approximate ATR for setting stop distances.
Conclusion
Volume tells you how much participation sits behind a move; volatility tells you how far price usually travels. ATR turns volatility into a practical ruler for stop distances, and Bollinger Bands show when price is stretched relative to recent behavior or when conditions have gone unusually quiet. None of them shows direction. Their real value is in risk control: when the market gets more volatile, give trades more room and cut your size so each loss stays the same in USDT.
Related reading
FAQs
- What is a good ATR value?
- There is no good or bad ATR; it simply measures how far a market typically moves per candle. It is most useful as a ruler for stop distances and for comparing markets, ideally as a percentage of price.
- Does a Bollinger Band squeeze tell me which way price will break?
- No. A squeeze shows that volatility has contracted, and quiet periods are often followed by more active ones, but the bands do not show direction. Traders usually wait for price to break out and close beyond a level before acting.
- Is volume on a CFD the same as volume on an exchange?
- Not always. A CFD is priced from a reference feed, so the volume figure you see depends on that feed and may reflect exchange trading or price-update activity rather than CFD trades. Use it to compare a market with its own recent history rather than as an absolute number.
- Should I use a wider stop when volatility is high?
- Many traders do, so that normal noise does not hit the stop. The key is to reduce the position size at the same time, so the amount you would lose at the stop stays within your risk limit.
- Can I see ATR or Bollinger Bands on the trade chart?
- The trade chart does not currently plot indicators, but you can turn on volume bars and the OHLC legend in the chart settings. The Markets page shows volatility readings, and traders can use a separate charting tool for ATR and Bollinger Bands.