Using Charting Tools and Indicators on Traders Portal
The Traders Portal trade chart explained: timeframes, chart types, settings and order lines, where to find RSI and moving-average readings, and how to pair an external chart.
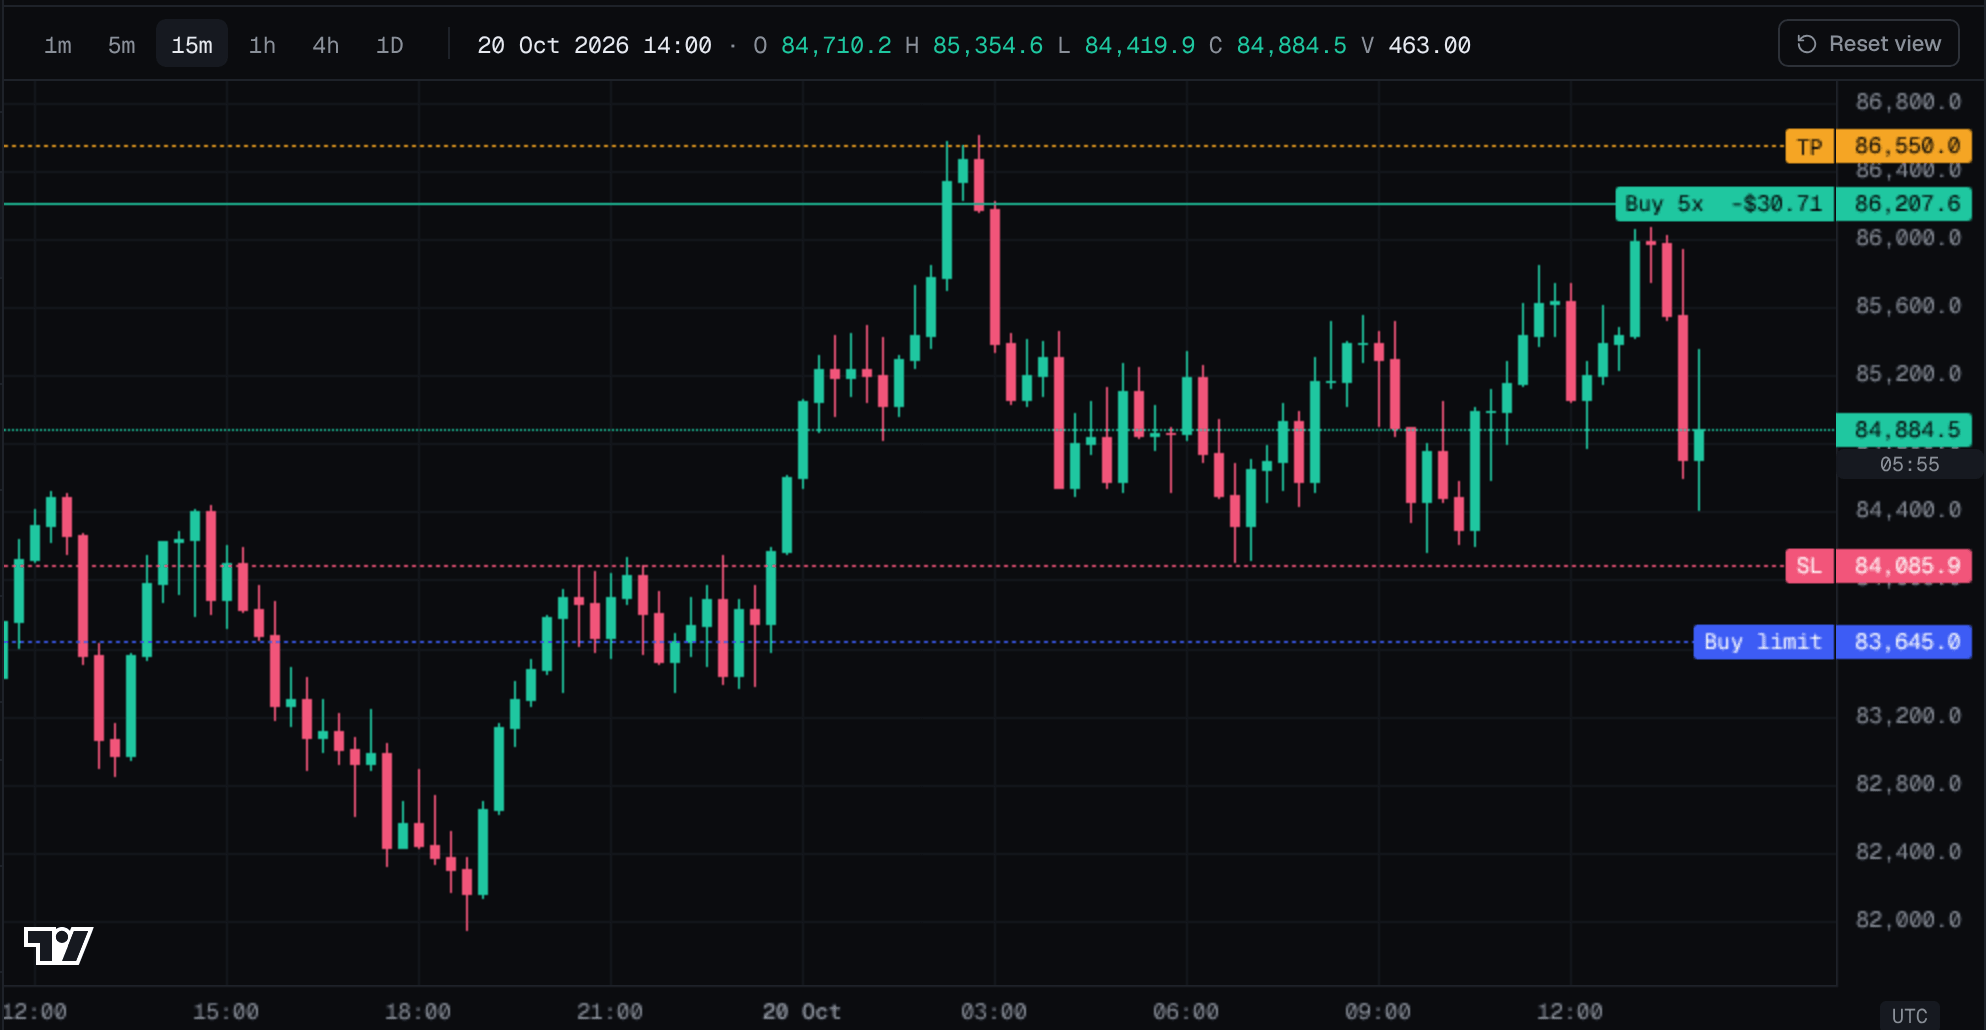
The trade chart on Traders Portal is built for two jobs: reading price and managing your orders. It gives you clean candles, six timeframes, several chart types and a settings panel, and it draws your entry, take profit and stop loss as lines you can drag on desktop. What it does not include are indicators or drawing tools.
This guide shows how to set the chart up, how to trade from it, where RSI and moving-average readings appear elsewhere on the platform, and how to work alongside a separate charting tool if you want to draw trendlines or add indicators of your own.
Open a trade on Traders Portal
Timeframes and chart types
A timeframe is the period each candle or bar covers. On the 1h chart, each candle is one hour of trading; on the 1D chart, one day. Shorter timeframes show more detail and more noise; longer ones show the bigger picture. Many traders check a longer timeframe for the overall direction, then a shorter one for timing; Multi-Timeframe Analysis explains the method.
| Chart type | What it shows | Worth knowing |
|---|---|---|
| Candles | Open, high, low and close for each period | The standard view; most lessons assume it |
| Hollow candles | The same data, with hollow and filled bodies | An extra visual cue for the direction of each period |
| Heikin-Ashi | Averaged candles that smooth out noise | Prices are averaged, so don't read entries or stops from them |
| Bars | Open, high, low and close as a bar with ticks | The same data as candles in a slimmer form |
| Line | Closing prices joined by a line | Clean for spotting the overall direction |
| Area | A line chart with the space below shaded | Useful for a quick overview |
If candles are new to you, Reading a Candlestick Chart explains how to read one.
Setting up the chart
- Open the settings
Click the gear icon on the chart.
- Choose your lines
Set the style for the entry, TP, SL, pending-order, break-even, bid / ask and last-price lines, and switch on P&L on position lines to see each position's live result on the chart.
- Adjust the display
Pick colors, the grid, the volume pane, the OHLC legend (the open, high, low and close of the candle under your cursor), axis tags and a candle countdown showing the time left in the current candle.
- Set scale and time
Choose a normal, log or % scale, and UTC or local time.
- Save a template
Save the setup as one of three templates, for example one for fast intraday charts and one for daily analysis.
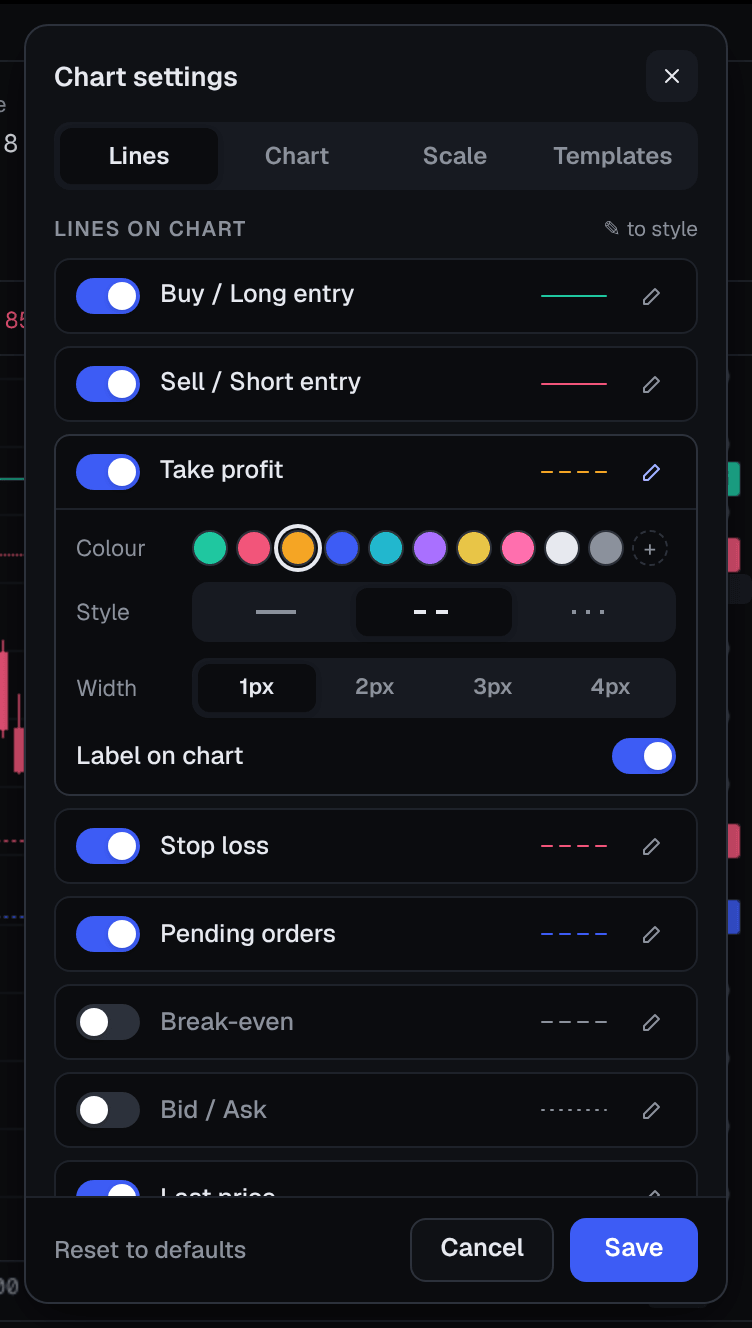
Showing the bid and ask lines is especially useful. Buys fill at the Ask, while a buy's TP and SL trigger on the Bid, so seeing both quotes tells you how close a level really is.
If you scroll back through history, a Back to latest pill returns you to the current candle, and Reset view restores the default zoom.
Managing orders on the chart
When you hold a position, the chart draws its entry, TP and SL as lines, and any pending orders as their own lines. On desktop you can drag a pending order or a TP / SL line to a new price. The platform asks you to confirm before anything changes.
Where to find indicator readings
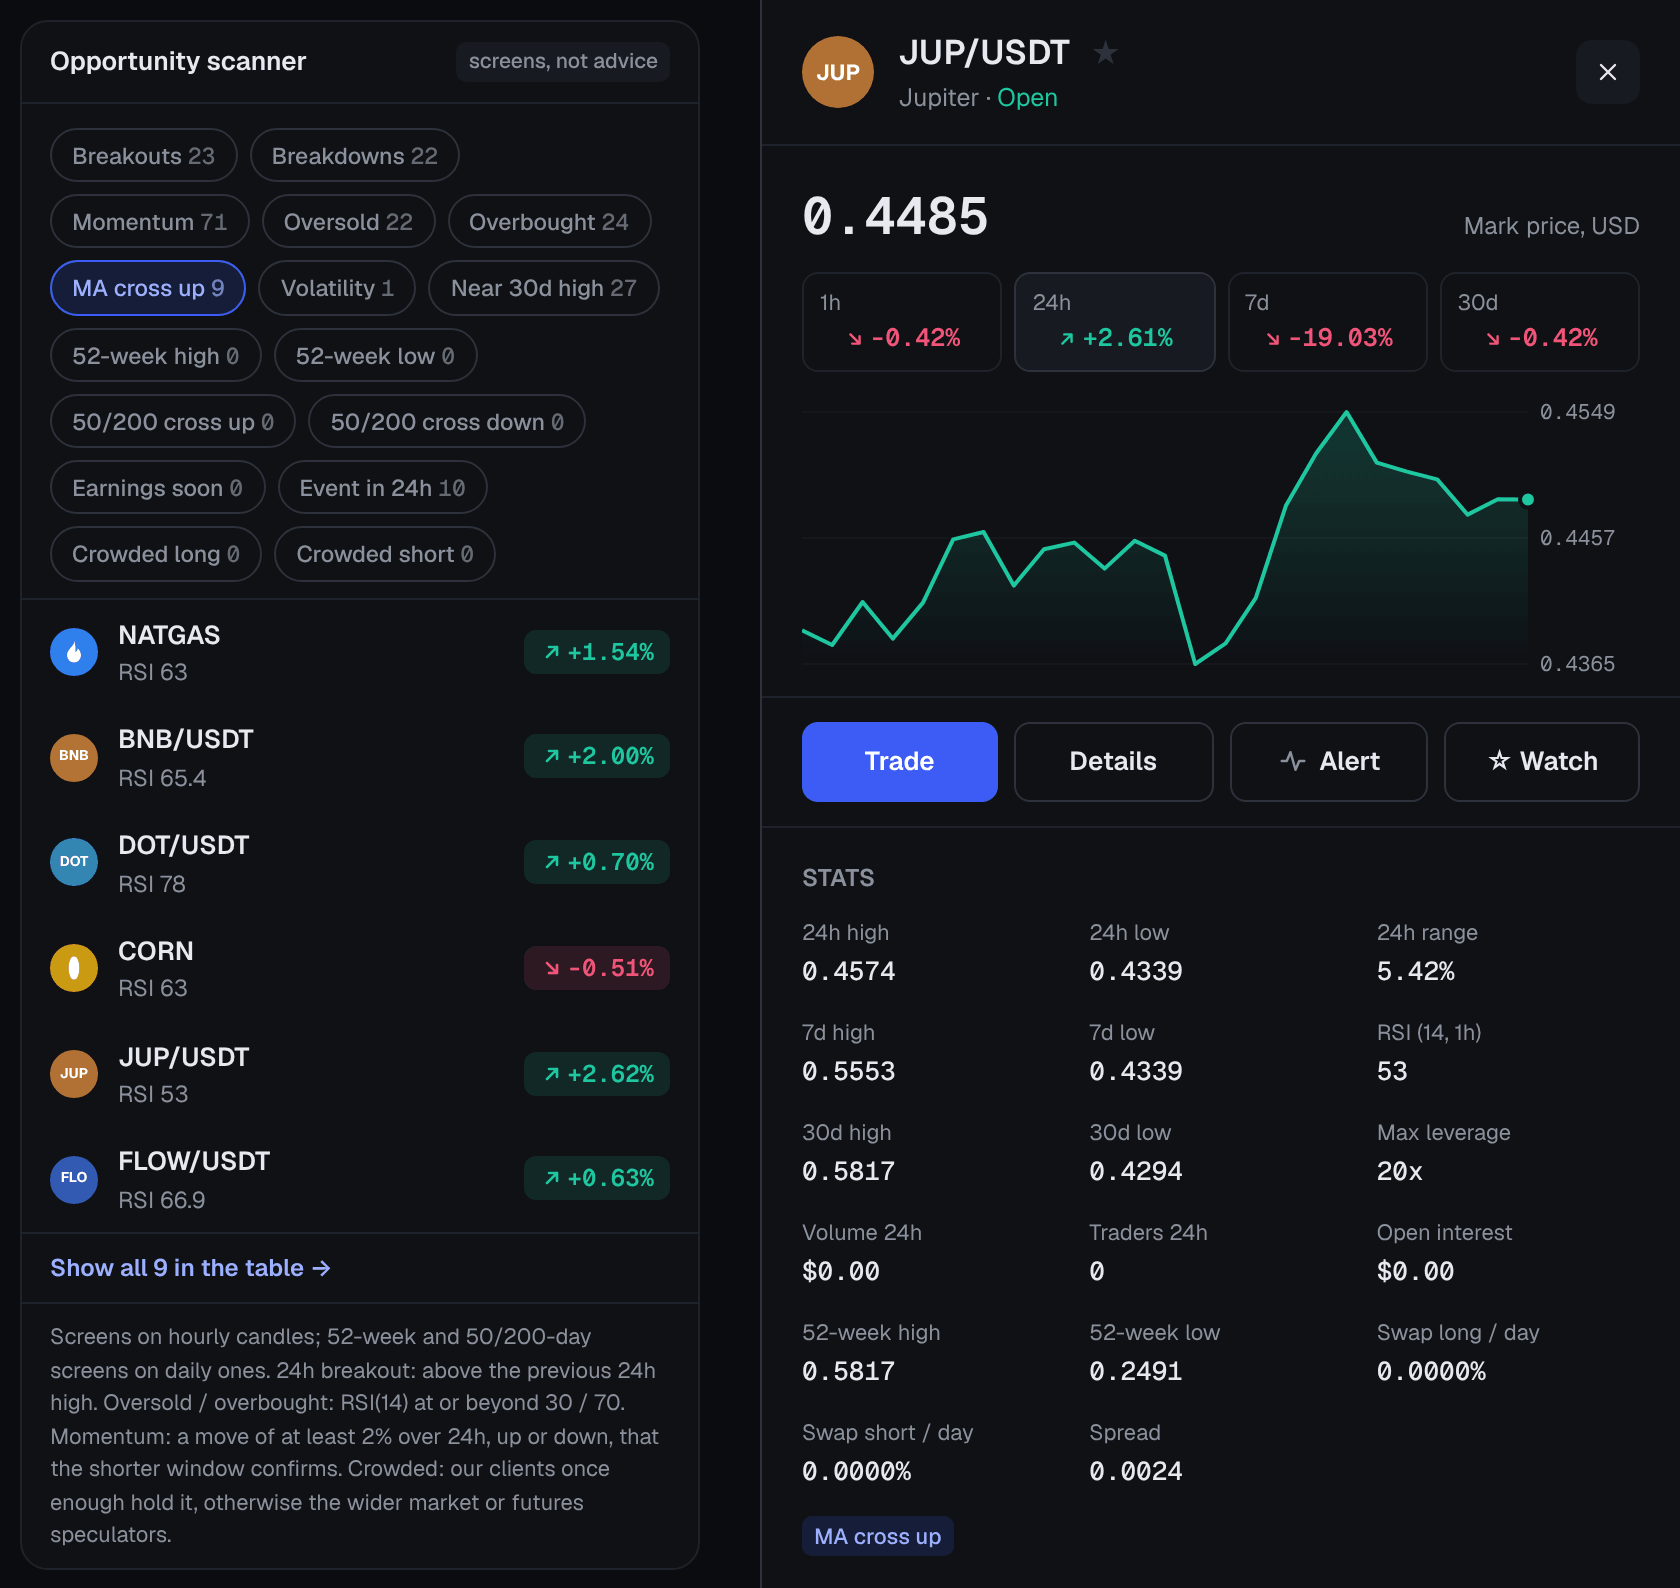
The trade chart has no indicators or drawing tools. Instead, the Markets page's opportunity scanner and quick view show RSI and moving-average-cross readings for each market.
- RSI (Relative Strength Index) is a momentum reading from 0 to 100. Readings above 70 are often called overbought and below 30 oversold. These are conventions, not signals: in a strong trend RSI can stay high or low for a long time.
- A moving-average cross happens when a shorter-term average of price crosses a longer-term one. It describes a change in trend after the fact, so it tends to lag.
To learn how these readings work, see RSI, MACD and Stochastic and Moving Averages.
Other analysis tools on the Markets page
The Markets page carries more context that the trade chart does not show:
- Economic calendar and news. Scheduled events such as interest-rate decisions or inflation data often bring sharp, fast moves, so check them before you place or move a stop.
- AI market brief. A short written summary for a market, including a "why is this moving?" explanation when the price moves sharply. Treat it as a starting point for your own research, not as a signal.
- Sentiment. The share of Traders Portal clients who are long a market. It shows how other clients are positioned, not where the price will go.
Pairing an external charting tool
If you want trendlines, Fibonacci levels or indicators on the chart itself, you can do your analysis in a separate charting tool and place your orders on Traders Portal. You don't need to give that tool your Traders Portal login.
- Analyze in your charting tool
Draw your levels and add your indicators as usual.
- Compare the prices
Put the two charts side by side and note the gap between the external price and Traders Portal's Bid and Ask at the same moment.
- Translate your levels
Adjust each level for that gap before you use it on Traders Portal.
- Place orders and alerts on Traders Portal
Enter Limit / Stop orders and TP / SL on Traders Portal, and set price alerts from Account → Alerts or the bell on a market row, so everything runs on the prices your orders actually use.
Conclusion
The Traders Portal trade chart gives you six timeframes, six chart types, a detailed settings panel with three templates, and order lines you can drag on desktop. It has no indicators or drawing tools: RSI and moving-average readings sit in the Markets scanner and quick view, and an external charting tool can fill the gap, as long as you translate its levels to Traders Portal's prices. Indicators describe past price; they do not predict it, so treat them as context, not certainty.
Related reading
FAQs
- Can I add indicators like RSI or moving averages to the trade chart?
- Not to the trade chart itself, which has no indicators or drawing tools. RSI and moving-average-cross readings appear in the opportunity scanner and quick view on the Markets page.
- Can I draw trendlines on the Traders Portal chart?
- There are no drawing tools on the trade chart. Many traders draw their levels in a separate charting tool, then place and manage their orders on Traders Portal.
- Why does my external chart show slightly different prices?
- Data sources differ. Traders Portal quotes a Bid and an Ask around its own reference price, while another chart may show one exchange's prices or a different feed. Your orders, TP and SL always trigger on Traders Portal's prices.
- What is a log scale and when is it useful?
- A log scale spaces prices by percentage change rather than by dollar amount, so a move from 20,000 to 40,000 takes the same height as a move from 40,000 to 80,000. It helps on long time ranges and in markets that have moved a long way.
- Can I save my chart setup?
- Yes. The chart settings let you save up to three templates with your preferred lines, colors and display options.