Platform Tour: Chart, Order Panel, Positions, History
A guided tour of the Traders Portal trade screen: navigation, the chart, the order panel, the positions tabs and your account figures, and what every label means.
The Traders Portal trade screen packs a lot into one view: a live chart, an order panel, your positions and your account numbers. Once you know what each part does and where the key labels sit, placing and managing a trade feels far less stressful.
This tour starts with how to get around, then walks through the trade screen zone by zone, finishing with the figures that show how healthy your account is. Open the trade screen in another tab and follow along; nothing in this tour places a trade.
Getting around
On desktop, the top bar holds Trade, Markets, Portfolio, Wallet and More, which opens the Academy, Glossary, Account, Support and Earn pages. The Deposit button sits alongside, and your account menu holds Dashboard, Personal information, Security, Deposit, Withdraw, Support and Log out. On a phone, the bottom tab bar gives you Portfolio, Markets, Trade, Wallet and Account.
| Page | What it is for |
|---|---|
| Trade | The chart, order panel and positions for one market |
| Markets | Browsing every market, plus sentiment, the economic calendar, news and price alerts |
| Portfolio | Overview, Positions and Money movements across your whole account |
| Wallet | Your USDT balance and money in and out |
| Account | Personal information, Security, Deposit, Withdraw, Alerts, Notifications and Support |
Choosing a market
The Markets page lists every market by asset class: crypto, forex, commodities, stocks and indices. Crypto and commodities are quoted against USDT (BTC/USDT, GOLD/USDT), forex pairs keep their usual names (EUR/USD), and indices and stocks use short codes such as NAS100 or AAPL. Each market's trade screen has its own address, for example /trade/BTC or /trade/GOLD. The Markets page also carries the economic calendar, news, a bell icon on each row for price alerts, and sentiment: the share of Traders Portal clients who are long.
Zone 1: the chart
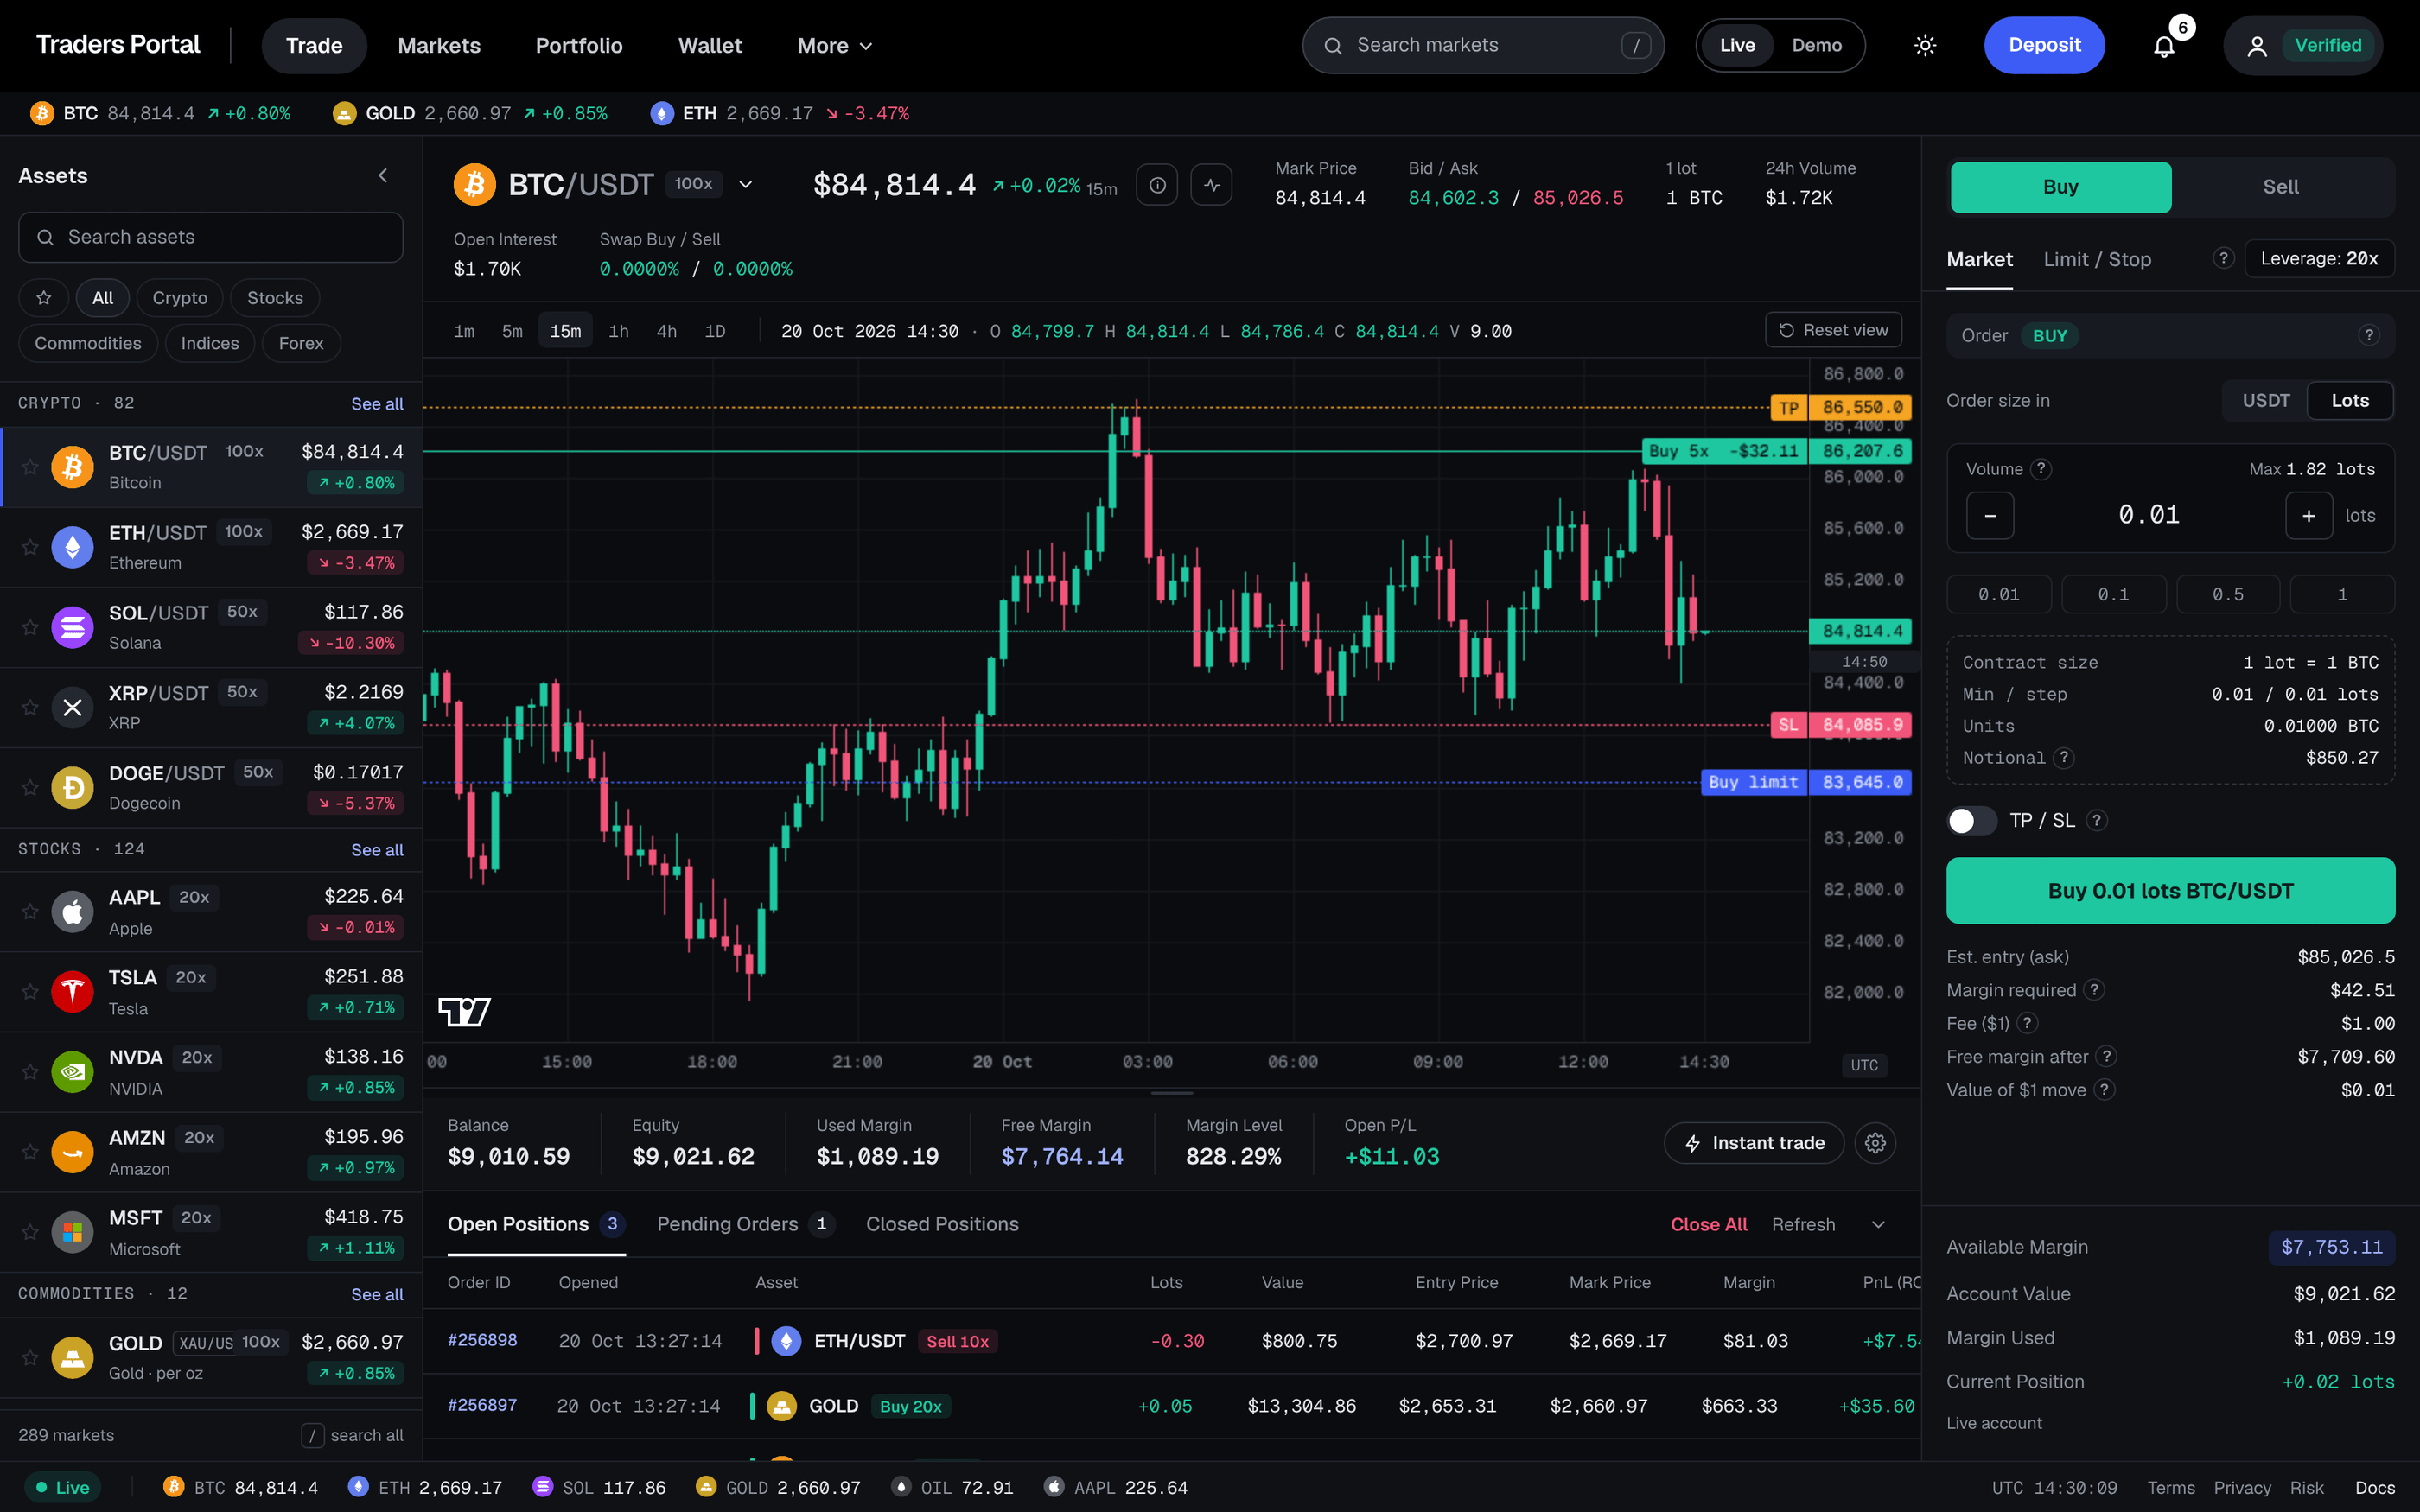
The chart fills the middle of the screen. Pick a timeframe (1m, 5m, 15m, 1h, 4h or 1D) and a chart type such as candles, bars or line. The gear icon opens the chart settings. When you hold a position, lines mark its entry, take profit and stop loss; on desktop you can drag pending orders and TP / SL lines to new prices, and the platform asks you to confirm. If you scroll back in time, a Back to latest pill brings you to the current candle, and Reset view restores the default zoom.
The trade chart has no indicators or drawing tools. Using Charting Tools and Indicators explains what it does offer and where to find readings such as RSI.
Zone 2: the order panel
The order panel on the right is where every trade starts. From top to bottom:
- Buy / Sell. A market buy fills at the Ask, the higher of the two prices; a sell fills at the Bid.
- Market and Limit / Stop tabs. Market opens now; Limit / Stop waits for your price.
- Size, with a USDT / Lots toggle. Amount is the position's value in USDT, with a 0–100% slider; Volume is the size in lots.
- Leverage: Nx. Opens the Adjust Leverage slider. Leverage is chosen per order.
- TP / SL. A switch for take profit and stop loss, set as a price or as a USDT amount.
- The order summary, then a footer showing Available Margin, Account Value, Margin Used and Current Position.
| Row | What it tells you |
|---|---|
| Est. entry | The price the order is expected to fill at |
| Margin required | Position value ÷ leverage, locked while the trade is open |
| Fee | The trading fee for this order |
| Free margin after | What is left for new trades and to absorb losses |
| Value of $1 move | How much your profit or loss changes for each $1 the price moves |
On desktop there is also Instant Trade: one-click market orders with preset sizes, buttons to close 25%, 50% or 100% of a position, a flip button and optional hotkeys. Placing Orders covers every order type step by step.
Zone 3: positions, orders and history
Below the chart are three tabs:
- Open Positions lists running trades with the columns Order ID, Opened, Asset, Lots, Value, Entry Price, Mark Price, Margin, PnL (ROE) and TP / SL. Mark Price is the current reference price; PnL (ROE) is your profit or loss in USDT and as a percentage of the position's margin. Actions lets you Close the whole position or Edit TP / SL, and the tab also offers Close all and Cancel all orders.
- Pending Orders holds Limit and Stop orders waiting for their price. Their margin is reserved as soon as you place them.
- Closed Positions is your history: Exit Price, Closed, Reason (Closed, Take profit, Stop loss, Liquidation and so on), Fees, Swap and Net PnL.

Zone 4: the client bar
The client bar shows your account at a glance. Balance is your cash after closed trades. Open P/L is the unrealized result of open positions. Equity is balance plus any credit plus open P/L. Used Margin is the margin locked by positions, and Free Margin is what remains for new trades after used margin and any margin reserved for pending orders. Margin Level is equity ÷ used margin, as a percentage.
If the margin level falls, you receive alerts at the warning level set for your account and the critical level set for your account, and if it reaches the stop-out level set for your account, positions start to close automatically. Margin, Leverage and Liquidation Price explains the math.
Beyond the trade screen
The Portfolio page brings everything together in three views: Overview, Positions and Money movements, which lists deposits and withdrawals. The Wallet shows your USDT balance and is where a demo balance can be reset.
Conclusion
The trade screen has four zones: the chart for reading price, the order panel for building a trade and seeing its cost, the positions tabs for managing what is open and reviewing what is closed, and the client bar for the health of your account. Learn where each label lives before you place real money, keep an eye on Margin Level, and remember that leveraged trading carries a high risk of loss.
Related reading
FAQs
- Where do I see my open trades?
- On the trade screen, open the Open Positions tab below the chart. Each row shows the entry price, the current mark price, the margin used, the profit or loss and any TP / SL, with buttons to close the position or edit its TP / SL.
- What is the difference between Balance and Equity?
- Balance is your cash after closed trades, deposits and withdrawals. Equity adds any credit and the unrealized profit or loss of your open positions, including swap, so it moves with the market while trades are open.
- What does ROE mean in the Open Positions tab?
- ROE (return on equity) shows a position's profit or loss as a percentage of the margin it uses. Because margin is only part of the position's value, ROE moves much faster than the price itself.
- Can I use the platform on my phone?
- Yes. On a phone, the tab bar at the bottom gives you Portfolio, Markets, Trade, Wallet and Account. A few tools, such as Instant Trade and dragging orders on the chart, are desktop only.
- Where do I find a closed trade's final result?
- Open the Closed Positions tab on the trade screen. It shows the exit price, when the trade closed, why it closed, the fees and swap charged, and the net profit or loss.